Thank-you for visiting this page. We have assembled this information in an effort to keep you informed with the most recent and relevant.
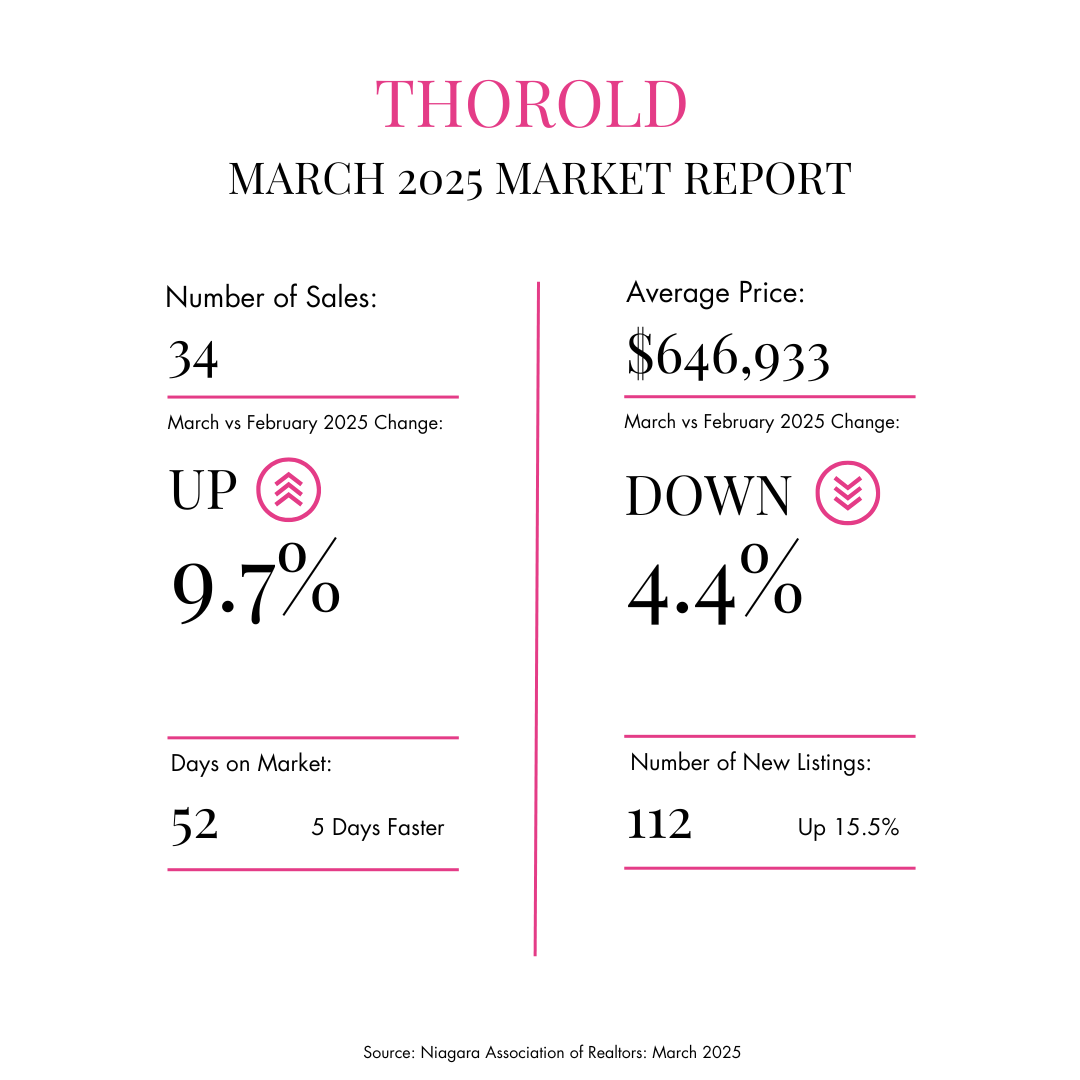
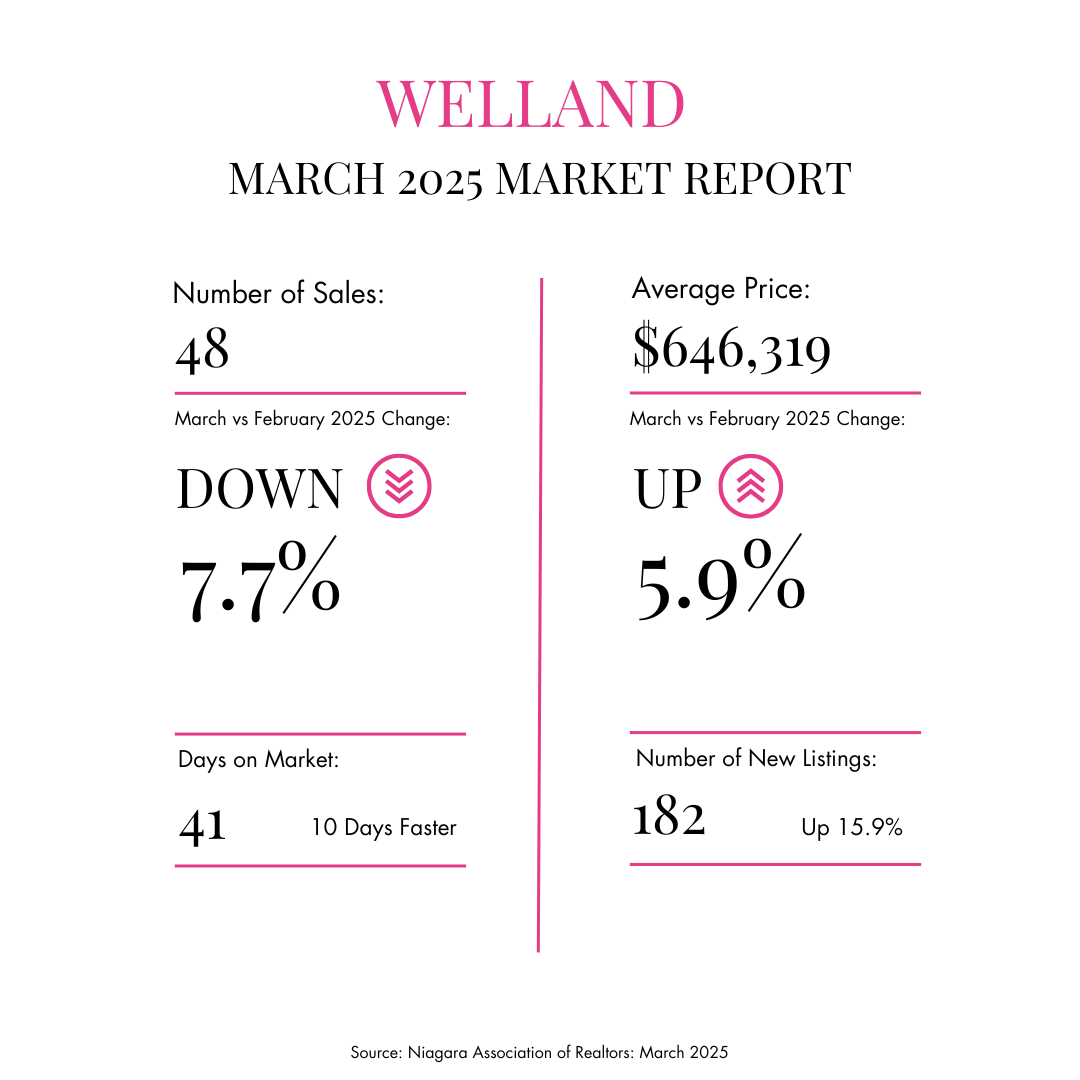
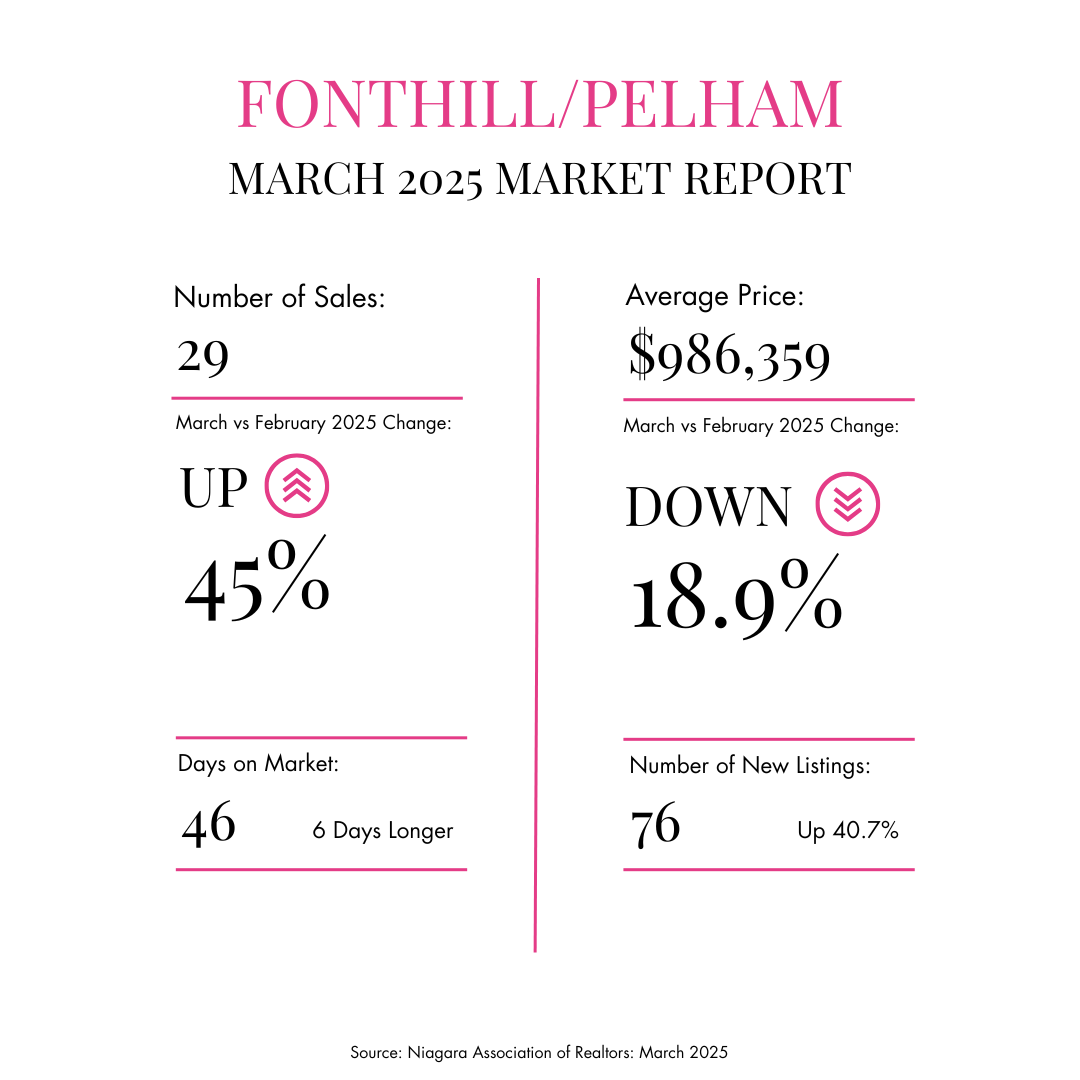
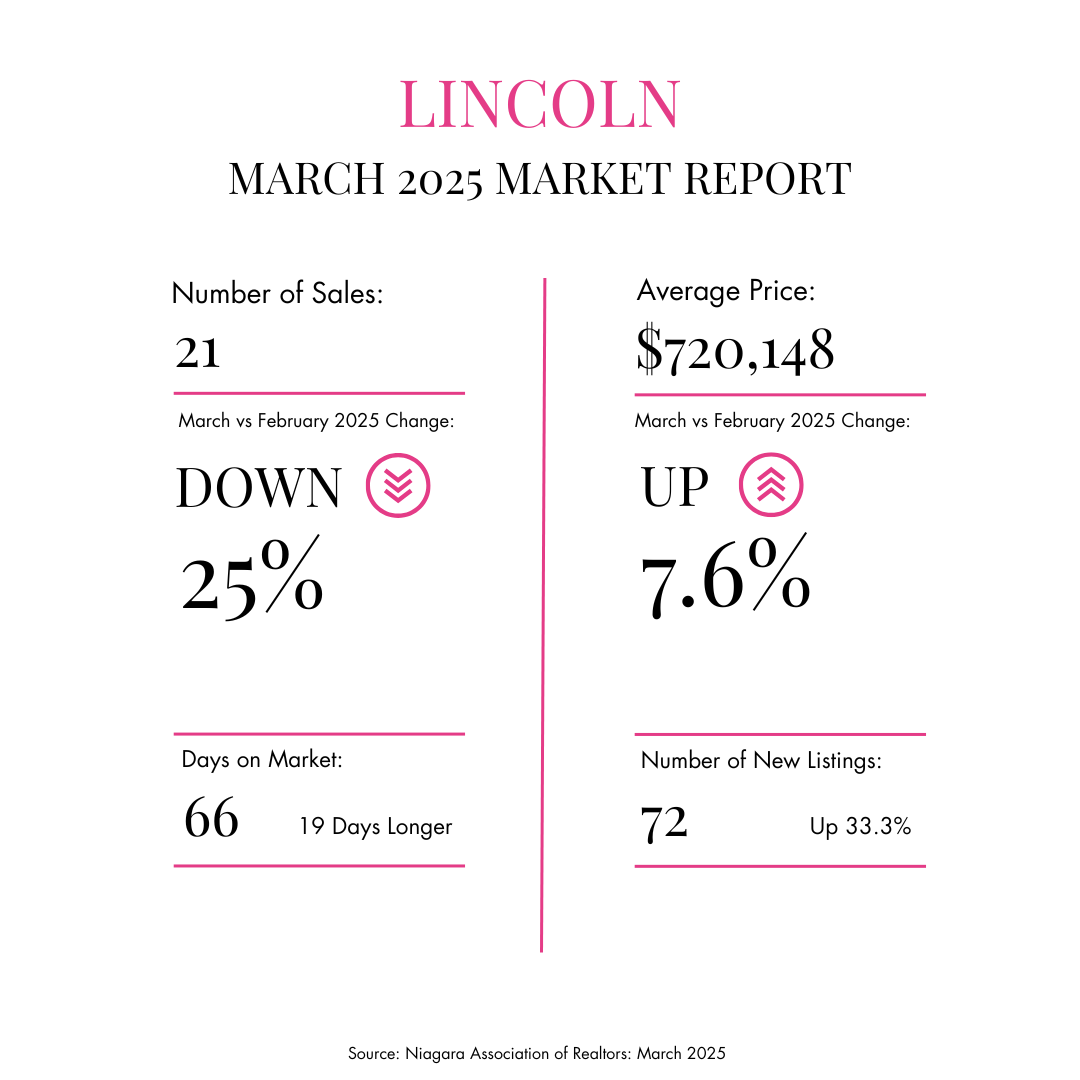
For the start of the Spring Market in the Niagara Region thus far (March), we have some interesting numbers.
We still are not seeing the sales numbers that many predicted would correlate with numerous interest rates drops and what has been expressed as “pent up demand” as of late. This could be a result of a consumer confidence impact from the US political decisions, but of course many factors affect home purchases, including affordability concerns despite the rate drops.
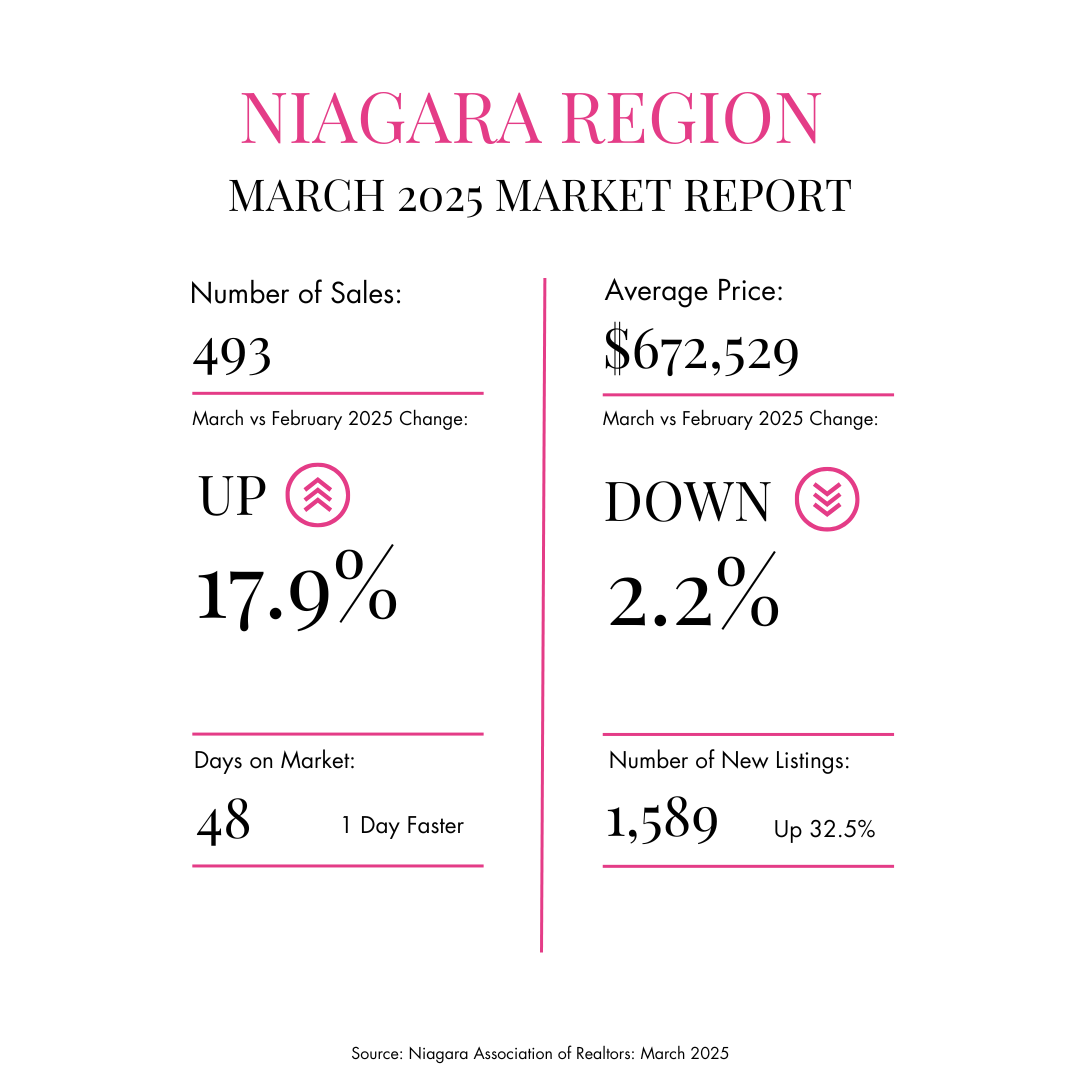
We did see a record high for March, over the last ten years for new listings at 1,589. Close in number, but still surpassing March of 2021, where we saw a year over year average sale price increase of 37.1%.
This year, for year over year price change, from 2024 to 2025, the price has dropped, from $714,811 to $672,529, 5.9%. Buyers, this is good news for you. We have only seen two decreases in average sale price for March year over year, for the last 10 years, in 2018, very slightly and a large difference from 2022 to 2023. Conversely to a record number of new listings for March, we saw a record low number of sales, 493, significantly lower than any year over the last ten years. We are down 19.8% year over year. Again, good news for buyers. We have abundant inventory, lower demand situation, but now with lower mortgage rate opportunities than we saw in 2023 and 2024.
Number of days to sell a home though is running it’s own course entirely. Despite plentiful inventory, and lower demand, days on market for March at 48, has remained the same as February but homes are selling 29 days faster year over year, so we have some good news for sellers also!
In a market, such as this, where there is a lot of competition in respect to listings, it is very important to have someone who is knowledgeable and prepares you well to navigate the challenges (ex. Being priced appropriately). Here at McGarr Realty we ensure we are positioning our clients for as successful a transaction as possible, while being mindful to provide them an extraordinary Real Estate experience overall!
We would be honoured to assist you in navigating your Real Estate needs, so please do not hesitate to reach out!
There are a few things for you to know:
Again, we hope you have found this helpful. We will continue to update all of the above as we move through the coming weeks and months.
Your feedback, thoughts or inquiries are always welcome.
You can contact us here.
Most importantly, take good care and be safe.
The McGarr Team.
The Latest